Fundratios is the charity fundraising benchmarking project which we operate in conjunction with the Institute of Fundraising.
Fundratios 2013 - Overview of Results
1. Introduction and Overview
Fundratios is designed to help all charities, both large and small, to fundraise more effectively by producing a comprehensive analysis of all aspects of fundraising. This document summarises the key findings of the most recent project.
Seventeen charities with a total income of £1.13 billion participated in the study. The average year-end of those taking part was March 2013.
Net of trading costs, total income was £1.0 billion; £0.48 billion (49%) was derived from voluntary income; fees for services and grants provided 35% of total income. Trading income net of costs provided 9.9% of total income.
Although the charity sector as a whole managed to maintain growth throughout every year of the recession, growth slowed in 2012 and the first quarter of 2013. The Fundratios group also had a disappointing year with total voluntary income 0.8% lower; lower legacy receipts were a key factor.
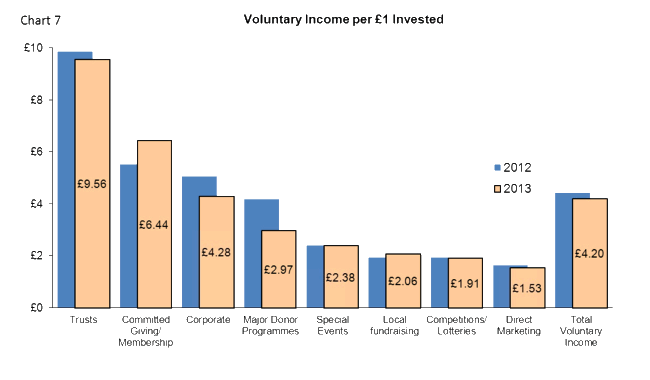
The median return on investment for the 17 charities fell from £4.42 in the previous year to £4.20 per £1 invested. Excluding legacies, the median return on active fundraising was slightly higher at £3.16 per £1 invested compared to £3.07 in the previous year.
2. Sources of Voluntary Income
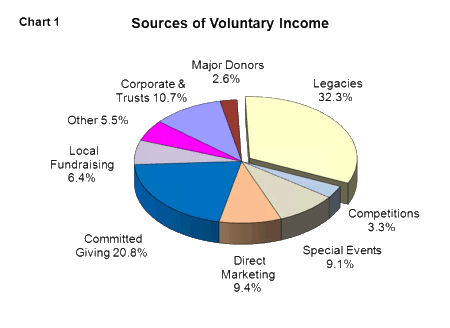
Chart 1 below shows a simplified analysis of the main sources of voluntary income. For charities in the latest Fundratios report, Legacies provided 32% of total voluntary income. The remaining 68% was actively fundraised.
Of the actively fundraised sources, committed giving including membership was the largest sector accounting for 20.8% of total voluntary income or over 30% of actively fundraised income. Committed Giving received less investment (-10.6%) in 2012/13 and the growth rate of just 1.2% was the lowest in the last 20 years.
Direct marketing and special events both generated 9% of total voluntary income or between 13% and 14% of actively raised funds. Both categories enjoyed good growth in 2012/13. Local fundraising generated 6.4% of total income with a modest 1.7% growth rate.
3. Revenue Growth
Only four of the 17 charities increased their total voluntary income in 2012/13. In many cases, lower income from legacies was the key factor. Excluding legacies, eight of the 17 charities showed positive growth in voluntary income.
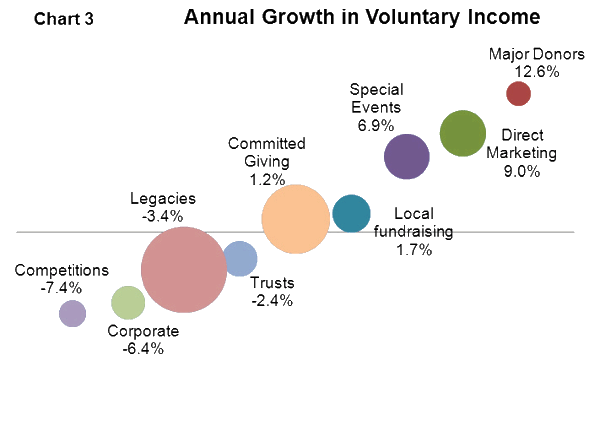
The weighted average fall in total voluntary income for the 17 charities was 0.8%. Legacy income fell at a faster rate of -3.4%, actively fundraised income was 1.1% higher.
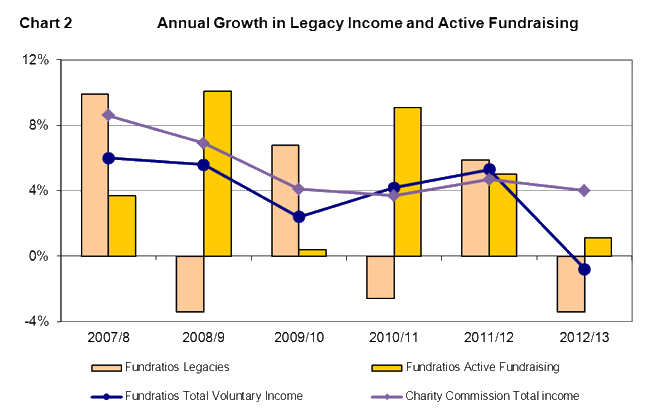
Figures from the Charity Commission showed aggregate voluntary income in the year to December 2012 for 164,000 charities of £18.2 billion, which was 2.6% higher than a year earlier. This represented a marked slowdown in growth rates from the previous year. Growth in the year to March 2013 improved somewhat to 5.0% for the sector as a whole. Average growth for the Fundratios group slowed even more than the charity sector as a whole. Chart 3 shows the growth in voluntary income over the previous year for the Fundratios group; the size of each “bubble” is relative to the sums raised.
4. On-line Fundraising
This year for the first time, Fundratios participants provided data on on-line fundraising.
It is clear that on-line fundraising is growing rapidly. Total income raised on-line for the Fundratios charities increased by 17% compared to the previous year and by 40% over the last 2 years. The number of donations rose by 44% over the 2 years.
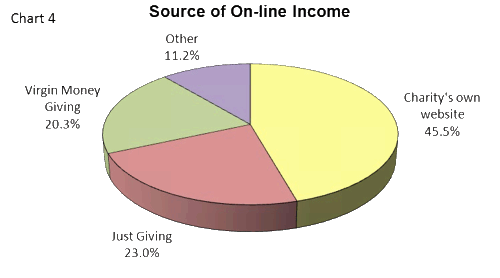
On-line income grew on average from 4.4% of Voluntary Income (excluding legacies and trust income) in 2010/11 to 6.2% in 2012/13.
Income from charities' own web-sites grew by just over 20% pa in each of the last two years.
For the Fundratios charities, income from Just Giving increased by almost 23% over 2 years whilst Virgin Money Giving income was 59% higher but the latter was starting from a lower base. Clearly one has to treat these figures with a certain caution as different charities may be more closely associated with one on-line donation service rather than another.
Virgin Money Giving itself, reported that total donations to all charities increased by 25% in 2012 and 11% in 2013. We do not have corresponding figures for Just Giving.
In 2012/13 the average on-line donation from all sources was £20.6, which was 2.3% higher than the previous year. The average for charities' own web-sites was £21.4.
For sponsored fundraising, the average amount received per donor was £263, with an average donation per sponsor of £17.5.
Not all charities could identify how many on-line donors were already on their supporter database; for those that did know, the average was just under 45%.
Based on the Fundratios data, it appeared that gift aid claim rates for Virgin Money Giving were similar to charities' own web-sites but were perhaps higher than for Just Giving.
Those charities that said their web-site had an opt-in facility for donors to receive emails and/or newsletters reported an average take-up rate of 26%.
In the latest year, total digital expenditure increased by 18% and on-line income grew by 11% so that expenditure edged higher from 10.0% to 10.6% of income raised.
5. Fundraising Expenditure
Seven of the 17 charities (41%) increased their fundraising expenditure during the year but only three were able to combine increased investment with positive income growth. Chart 5 compares the growth in expenditure and income over the latest year for the 17 charities. Of course, for several types of fundraising, expenditure in one year may not generate income in the same year.
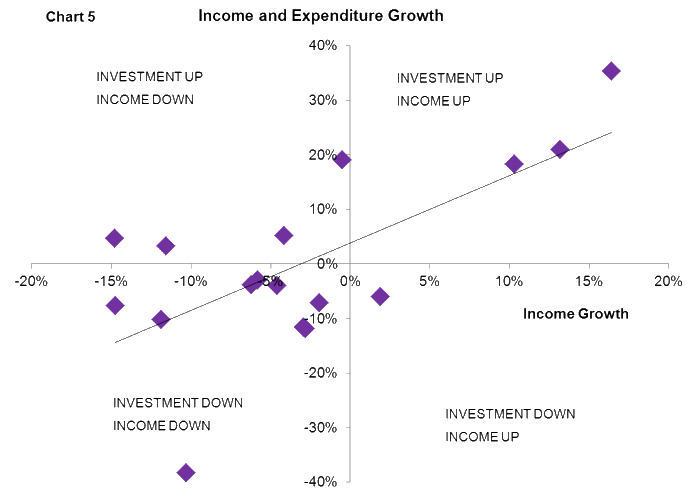
The charities in the study reduced their (weighted) average expenditure by 1.1% whilst voluntary income fell by 0.8%. As a result there was practically no change in the overall average cost effectiveness but at the individual charity level, lower returns on investment were reported by 70% of participants.
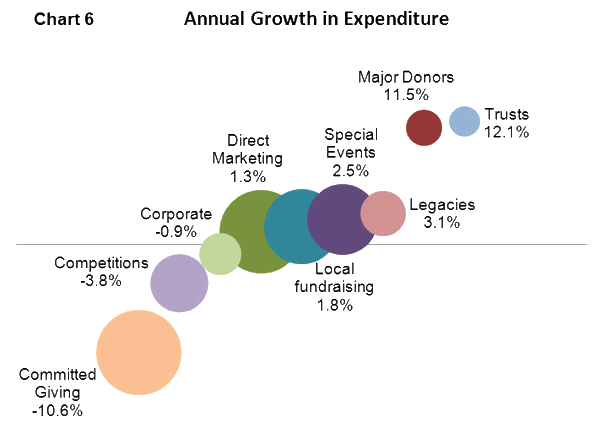
Looking at all 17 charities, investment increased modestly by between 1%-3% for local fundraising, direct marketing, special events and legacy marketing. Only two areas showed significant increases in investment: major donors and trusts.
Chart 6 shows the increase in expenditure in each category. The size of the bubble indicates the relative share of the total fundraising budget for each category.
6. Return on Investment
Fundratios has produced annual analyses of fundraising performance for almost 20 years. Over much of that period, the average return on fundraising investment declined from over £5 per £1 invested to only just about £4 in 2009. In the last three years the rate of return has stabilised in a range between £4.20 and £4.40.
In the latest year total expenditure for all 17 charities fell by 1.1%, which was close to the 0.8% decline in income. However, taking the median of the 17 individual results showed a return on investment of £4.20 per £1 of investment compared to £4.42 in the previous year for the same group of charities.
The overall return on investment is affected by the level of legacy income in a particular year. In 2012/13 legacy income declined by 3.4% whilst active fundraising income showed a rise of 1.1%. As a result the return on investment excluding legacies of £3.16 per £1 invested which was slightly higher than the previous year.
At a time when returns are falling or at best standing still, charities face the dilemma that extra investment to increase income will often produce a lower return on investment at least in the short term.
As we saw on Chart 6 the programmes that benefitted from the largest increase in budgets were Trusts, Major Donors, Legacies and Special Events. With the exception of Special Events (return unchanged), each of those categories produced a lower return on investment than the previous year.
The returns on the main fundraising activities (excluding legacies) are shown below. The average return for legacies was £27.27 per £1 invested (down from £30.96 in the previous year).
7. Highlights by Activity
Corporate
Corporate donations, sponsorship and payroll giving together provided 5.2% of voluntary income.
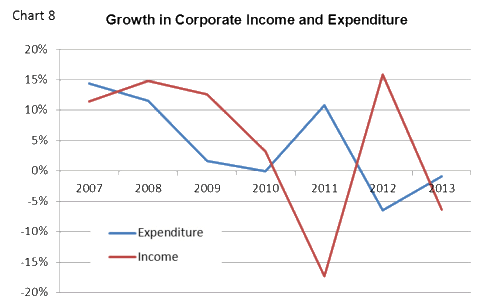
Corporate income fell by 6.4% whilst expenditure was practically unchanged. The reverse was true in the previous year when expenditure fell whilst income increased. Chart 7 highlights the 1 year time lag between changes in investment and the impact on income. The median income per £1 invested in 2013 was £4.28.
Corporate donations were 4% lower and income from sponsorship, promotions and licensing was also slightly lower.
Income from payroll giving improved with a 4% rise in the number of donors and a 3% increase in the average annual gift.
Trusts
Total income from trusts fell by 2.4% following a 3.3% drop in the number of grants. The median return on investment was down 3% at £9.56 per £1 invested. The median grant size was £6,516.
Major Donor Programmes
Charities taking part in Fundratios have been committing extra resources to Major Donor programmes in recent years. In 2011 and 2012, average expenditure rose by over 15%; in 2013 investment increased by a further 12%. On a weighted average basis, major donor income rose by 12.6% in the latest year. Two-thirds of charities reported positive growth. The average return was £2.97 per £1 invested.
Legacies
As usual, legacies provided the largest single source of income, averaging 32% of total voluntary income but income received was down by 3.4% in the latest year.
60% of charities faced a reduction in legacy income in the latest year.
There was a 3% increase in the average Residuary legacy helped by improving property and stock market values.
The median pecuniary legacy for all charities was £4,000 compared to £3,900 in the previous year for the same group of charities.
Gaming, Lotteries and Competitions
Income from lotteries and competitions has fallen in each of the last 5 years. The weighted average fall in 2013 was 7.4%.
Income per £1 invested fell slightly from £1.93 to £1.91.
Special Events
Income from special events continues to grow; taking each year's growth over a 3-year period cumulatively, income has increased 48%. Over the same three years, income from local fundraising has only grown by 3% in total so it may be that the popularity of special events is reducing opportunities for local fundraising. The median return on investment for events was unchanged at £2.38 per £1 invested.
Mass participation events remained popular amongst fundraisers and provided 63% of events income. The average gross profit margin of 71% was lower than the 75% achieved in 2012. Activity events produced 15% of income; with a median gross profit margin of 66% (unchanged from the previous year).
Direct Marketing Appeals
Direct marketing income increased by 9% after 3 years in which income levels hardly changed.
The median return on investment fell from £1.63 to £1.55 per £1 spent.
Warm direct mail provided 69% of direct marketing income with cold direct mail generating 15% of income. Other media produced 16% of income.
The response rate for warm direct mail was lower for the second year running at 8.3% (9.5% in 2012 and 9.7% in 2011) and income per £1 invested was also down at £2.98. The response rate for cold mailing was unchanged at 1%. Also unchanged was the average return on investment of £0.44 per £1 invested.
Other media, used by 11 of the charities, achieved a lower return of £1.54 per £1 spent compared to £1.66 in 2012.
Committed Giving and Membership
Committed giving and membership provided 21% of total voluntary income or excluding legacies, 31% of active fundraising income. In 2012/13 total aggregate expenditure fell by 10.6% but income increased marginally. The median return improved from £5.50 to £6.44.
The average first year income per new giver increased from £43 to £51. Acquisition costs were practically unchanged at £96 per new giver. Together these changes meant a better balance between cost and first year income for the second year in a row.
Less effort was allocated to encouraging existing donors to upgrade, 21% of existing donors were approached to increase their donation (28% in 2012) and 23% of those approached did agree an increase (32% in 2012). The average increase was £34 a year (just under £3 a month).
Local Fundraising
Income from local fundraising was strong in 2012 but only increased by 1.7% in 2013. Twelve charities reported income in this category; seven showed positive growth but five saw income fall. The median return on investment improved from £1.94 to £2.07 per £ invested.
Donations and Gift Aid
Donations received, which could not be directly attributed to other fundraising activities such as membership or shops, amounted to 0.9% of voluntary income (1.1% last year).
This year, committed giving was 73% gift aided (67% in 2012). Direct marketing was 61% gift aided (58% in 2012).
Tax recoveries from all sources provided 4.8% of voluntary income (4.2% in 2012).
Trading
Income from shops grew by 4.0% with a return on investment of £1.35. To test the results against a larger sample, we extracted data from the published accounts of 14 charities with a major retail presence. Annual growth for this larger sample of 4,500 shops was 3.4%, which was very close to the Fundratios result. The weighted average income per £1 of expenditure of £1.27 for the larger sample was slightly lower than the Fundratios result.
© CIFC Ltd 2014

If your charity is interested in taking part in Fundratios and for further information on the project, please click here
.