
Fundratios is the charity fundraising benchmarking project which we operate in conjunction with the Institute of Fundraising.
Fundratios 2007 - Summary Report
1. Introduction and Overview
Fundratios is designed to help all charities, both large and small, to fundraise more effectively by producing a comprehensive analysis of all aspects of fundraising. Twenty-eight charities participated in the study. This document sets out to summarise the key findings of the study, in order for the results to be incorporated more effectively in fundraising activity.
The proportion of total income derived from voluntary income was little changed at 57%, and fees for services and grants were again the second largest source of income at 19%.
The charities participating in the study enjoyed a successful year's fundraising, voluntary income rising by 9.5%. Importantly, legacy income grew by 8.8%, the best result in the past five years whilst active fundraising rose by 9.8%, more than twice last year's rate. All major activities enjoyed some growth.
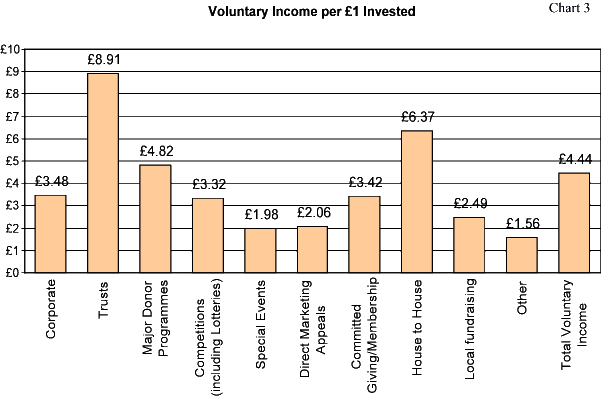
Return on investment remained satisfactory at £3.16 per £1 invested in active fundraising. The return on committed giving (the largest source of voluntary income after legacies) was £3.42 which is the best return since 2002.
2. Sources of Voluntary Income
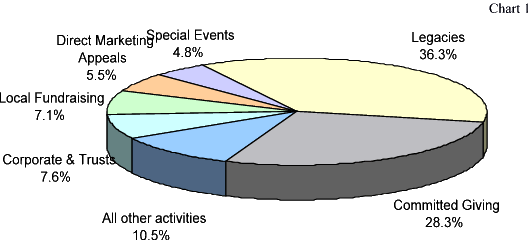
Chart 1 shows a simplified analysis of the main sources of voluntary income. As usual, legacies provided almost 40% of total voluntary income. Over 60% is actively fundraised, which means that the group of charities rely on active fundraising for over one third of their total income.
In recent years we have noted the seemingly unstoppable rise in the significance of committed giving as a source of revenue for charities. Last year however it was one of the slower growing activities (up 2.9%) but this year double digit growth resumed (up 12.6%). For this year's group it provided 28.3% of voluntary income which is 44.4% of active fundraised income.
Put into context, legacies apart, it provides more than three times as much money as any other activity.
Local fundraising provided 7.1% of the total with direct marketing, special events, corporate and trusts at around 5% each. Major donor programmes are now a significant item for many charities providing 3.3% of the total.
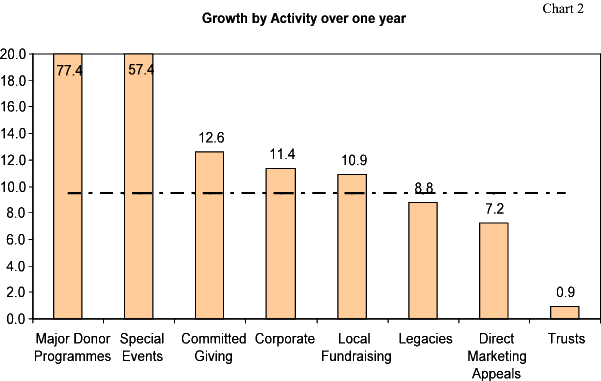
3. Revenue Growth
Better growth was one of the most satisfying features of this year's performance with voluntary income rising by 9.5% (c.f. 2.9% last year).
Although still relatively small, major donor programmes were the star performers this year with 77% growth. In fact only trust income stagnated, but even that was after a period of steady decline.
The chart below analyses growth by activity.
4. Fundraising Expenditure
The group of charities spent 12.8% more on fundraising this year. The average increase is shown by activity in the table below but it needs to be viewed with caution. Although committed giving, which takes the lion's share of the budget, attracted only 0.8% more funds, the majority of the charities spent considerably more. A few larger charities with a substantial committed giving income cut their expenditure heavily.
The biggest increase was the 63% rise in special events where expenditure fluctuates from year to year.
Major donor programmes where income rose by 77% actually suffered a cut in expenditure, the growth in income doubtless reflecting the heavy investment made in earlier years.
The main areas of expenditure are summarised in the table below:
Analysis of Fundraising Expenditure
|
Activity |
Share of Budget |
% increase (decrease) |
|
Committed giving |
37.6 |
0.8 |
|
Local fundraising |
15.8 |
7.8 |
|
Direct marketing appeals |
13.0 |
10.5 |
|
Special events |
12.4 |
62.9 |
|
Corporate |
6.1 |
14.4 |
|
Legacies |
3.3 |
4.0 |
|
Major donor programmes |
2.5 |
(29.4) |
|
Competitions/lotteries |
3.6 |
5.8 |
|
Trusts |
1.8 |
16.1 |
|
All other |
3.9 |
na |
|
|
|
|
5. Return on Investment
With expenditure (up 12.8%) rising slightly faster than income (9.8%) the rate of return on investment has inevitably fallen slightly (legacies apart the average return on investment fell from £3.18 to £3.16). Nonetheless net voluntary income (i.e. income minus expenditure) which is the amount available for the charity's use, rose by some 12%.
The returns on committed giving, direct marketing and trusts improved slightly; major donor programmes improved sharply but corporate, competitions, special events and local fundraising were less profitable.
The median returns are shown in Chart 3 except for those from legacies (£39.24) and emergency appeals for which there is little data this year.
6. Highlights by Activity
Corporate
Corporate donations, sponsorship and payroll giving together provided 4.6% of voluntary income, averaging £1.1m per charity for the group as a whole.
It was a successful year for corporate fundraising, with average growth of 11.4% in response to 13.9% higher expenditure. Income per £1 invested was £3.48.
Donations provided almost 40% of corporate income. Median growth was 14.8%, although the pattern varied greatly between charities. 'Corporate Charity of the Year' status continues to be valuable. The income from this averaged £48,500 compared with other donations averaging £2,000.
There was a 9.3% rise in income from corporate sponsorship which produced £3.00 per £1 invested.
Income from affinity cards averaged £5.54 per card, little changed on previous years, but total income fell 2.4%.
All of the charities reported an increase in the income from Payroll Giving, averaging a 23.1 rise%.
Trusts
For the fourth consecutive year there was little or no growth in income from trust grants. This year it rose by only 0.9% after a fall of 6.2% last year. Despite this the return on investment is high at £8.91 which would indicate that whilst there is little scope to expand trust income, the costs attached to it are modest, mainly staff time. For every £1000 of fundraisers' salaries, grants totalled £9,636 on average.
Major Donor Programmes
For several years charities have made significant investments in time and money to develop major donor giving. Until now they have, however, formed only a very minor element of voluntary income (under 2%) and the returns have been modest (under £3.00 per £1 invested). This year growth was an exceptional 77.4% - although 6 charities showed a fall in income.
Major donor programmes this year provided 3.3% of income and made a return of £4.82 per £1 invested compared with £2.98 last year.
Legacies
Once again legacies were the largest single source of income, averaging 36.3% of the voluntary income of the group (40% last year).
Growth was 8.8% after an increase of 4.6% last year and 6.5% previously. Longer term growth patterns for legacy income are erratic but have kept pace with inflation over a 5-10 year period.
Residuary legacies of under £250,000 provided 71% of all legacy income. Their typical value was £28,100. It is surprising, assuming that property forms a large element of most estates and given the rise in property prices, that this is the same as in 2001.
Pecuniary legacies averaged £3,000.
Gaming, Lotteries and Competitions
Lotteries and competitions this year provided 1.4% of voluntary income for the group as a whole, with just over half of the charities running lotteries. Growth was 12.9% and costs rose by 5.5%
Income per £1 invested was £3.28, similar to that of recent years.
Special Events
Investment in special events appears to go in cycles. Last year there was little additional expenditure; this year it soared by 68%. In response income increased by 57% diluting the return on investment slightly to £1.98.
Mass participation events provided almost half of events income and had a 63.7% gross profit margin.
Gala events which last year produced only 8.4% of events income, this year provided 23.2% with a 52.4% margin. Activity events provided 15.9% of income with a 55.9% margin.
Direct Marketing Appeals
Additional expenditure of 8.8% and income growth of 7.2% were the hallmarks of direct marketing this year.
Charities appear to have become more conservative in recent years, focussing more resources on proven activities, mainly warm direct mail, than on more speculative media.
Warm direct mail made a return of £4.31 from a 7.8% response rate.
The return from cold mailing was £0.37 per £1 invested, list exchanged produced £0.78 and other media £1.01.
The overall return from all direct marketing sources was £2.06.
Committed Giving and Membership
Committed giving is now established as the largest source of non-legacy income amongst those charities which have taken part in Fundratios in the past five years. This year it provided 28.3% of voluntary income and enjoyed growth of 12.6%.
Overall expenditure was practically unchanged (0.8%) but that figure can be misleading. Two charities with a large committed giving base cut back heavily on their expenditure. The median rise in expenditure was 24.7% and it took 37.6% of the charities' budgets. The median return is now £3.42 per £1 invested.
Retained givers provided 86% of the total income, their average annual gift being £72.32.
New givers cost on average £106.38 to acquire. The direct cost of cold acquisition of a new giver did not vary greatly - on average - between sources but the experience of individual charities varied greatly. For example, face-to-face marketing which was the largest source of new givers (30%) cost between £36 and £151 per acquisition and other media varied more.
The typical gift of a new giver was £74.00 p.a. (compared with £106.38 to acquire). The difference between these values underlines the importance of retaining givers. Attrition rates vary greatly and not all participants could provide data; it is an area which could be more effectively monitored.
House-to-House Collections
For the group as a whole house-to-house collections provided just 0.5% of their income. Only 10 charities had house-to-house collections and only one raised over £1 million.
Only one charity had a higher income than last year - on average it was down 3.9%. Nonetheless, house-to-house costs are low, making a return of £6.55 per £1 invested.
Local Fundraising
Despite declining in importance in the past decade local fundraising is still the third largest source of income, after legacies and committed giving. This year it provided 7.1% of the voluntary income of the group. In addition, activities such as lotteries, special events and house-to-house collections rely on local fundraisers so that, in total, local effort provided around 9% of all voluntary income.
After several years without significant growth this was the second successive year of double-digit increases (up 10.9%). The return on investment was £2.49.
Donations and Gift Aid
Donations received which could not be directly attributed to other fundraising activities such as membership or shops, amounted to 2.0% of voluntary income. By their nature they fluctuate significantly year by year and charity by charity.
This year committed giving was 74% gift aided. One charity achieved 90% but in a few cases it was below 50%.
Direct marketing was next best at 50% gift aided.
Relatively few major donations were gift aided, although this may reflect the fact that some major gifts made by an individual are directed through a trust or similar vehicle.
Shop Trading
Shop trading prospered with a 10.9% rise in sales and it made a return of £1.43.
Sales per shop now average £79,000 and the typical profit margin is 20%.
Mail Order Trading
Once again mail order income fell (by 9.7%) but margins were maintained at £1.48.
This year the typical response rate to main catalogues was 4.0% (a further fall) but average order size rose marginally to £30.50.
If your charity is interested in taking part in Fundratios:
We will be marketing Fundratios 2008 shortly. For further information on the project, please click here.